


RESOURCE CENTER
Stay up-to-date on cybersecurity industry
news through our content.

HWG Sababa Named a Major Player in Worldwide MDR Service for Midmarket
HWG Sababa has been named a Major Player in the IDC MarketScape: Worldwide MDR Service for Midmarket 2026 Vendor Assessment, among 20 MDR vendors evaluated.
HWG Sababa delivers a technology-agnostic MDR service powered by HyperSOC™, combining advanced threat intelligence, AI-assisted detection, hyperautomation, and deep expertise across IT and OT environments. The result is faster response, greater operational resilience, and a seamless extension of customers’ security teams.
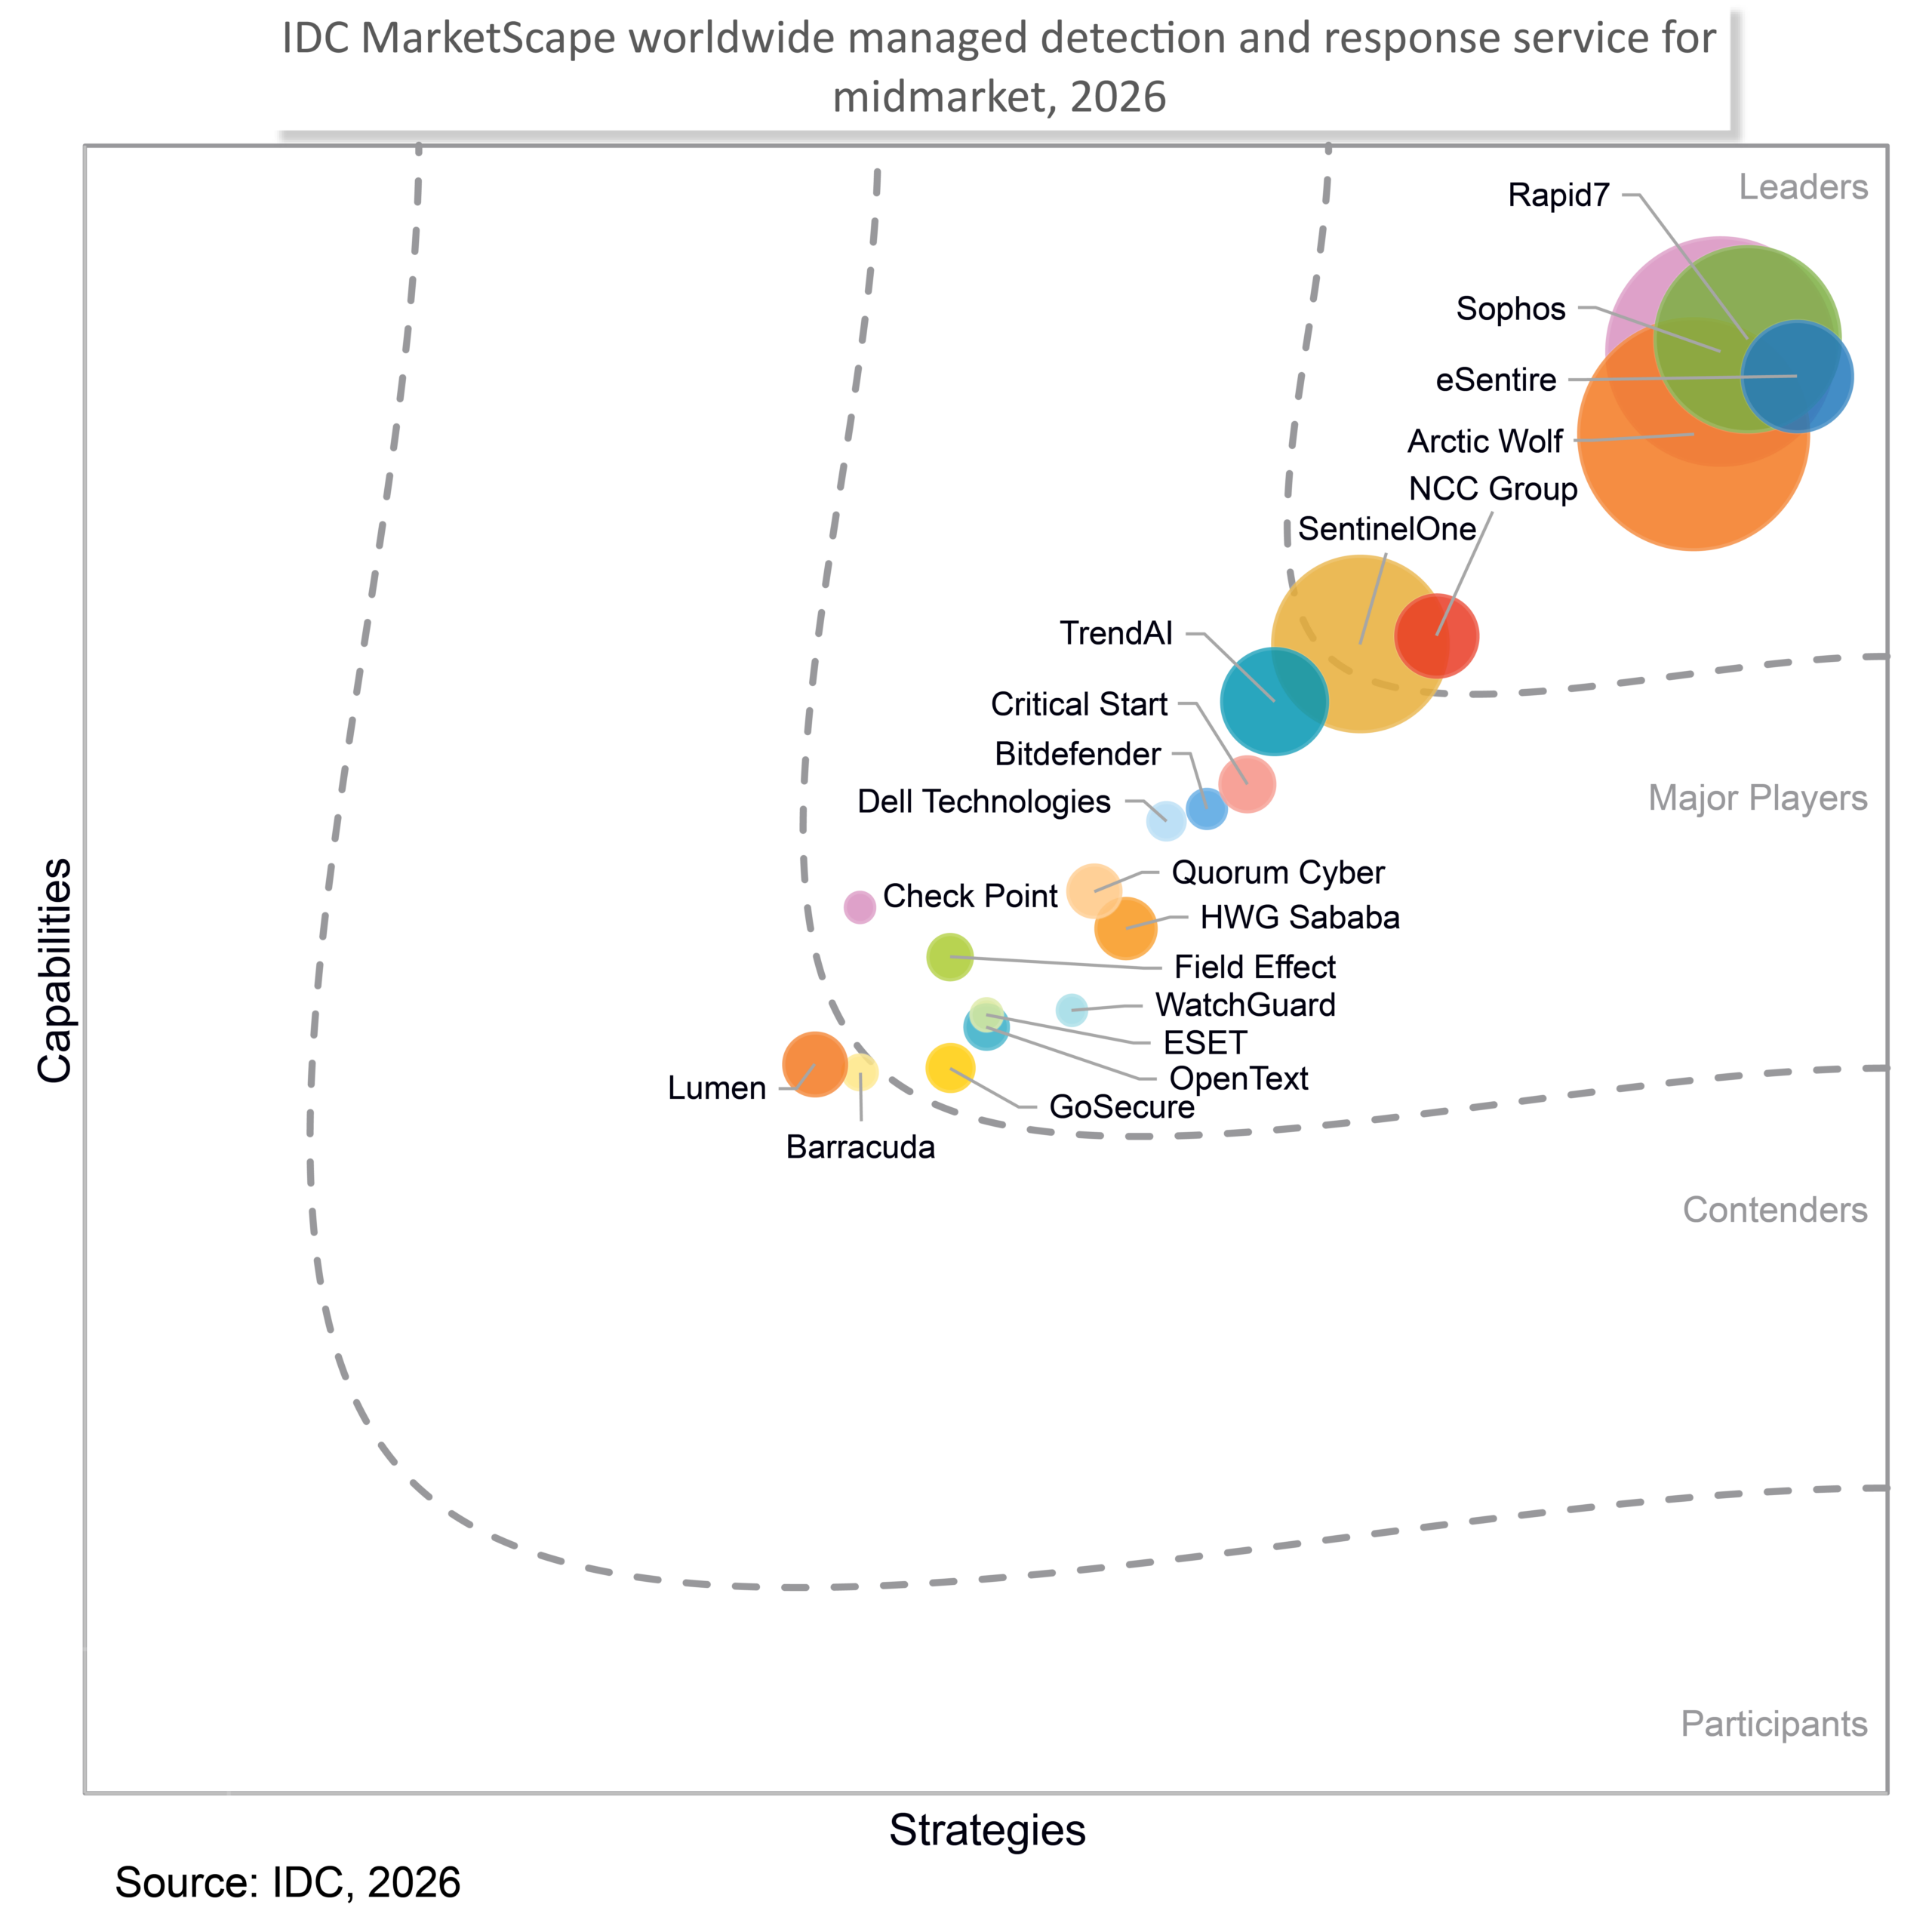
IDC MarketScape vendor analysis model is designed to provide an overview of the competitive fitness of technology and suppliers in a given market. The research methodology utilizes a rigorous scoring methodology based on both qualitative and quantitative criteria that results in a single graphical illustration of each supplier’s position within a given market. The Capabilities score measures supplier product, go-to-market and business execution in the short-term. The Strategy score measures alignment of supplier strategies with customer requirements in a 3-5-year timeframe. Supplier market share is represented by the size of the icons.
Download the excerpt to learn why HWG Sababa is a Major Player in Worldwide MDR Service for Midmarket.
Source: IDC MarketScape: Worldwide Managed Detection and Response Service for Midmarket 2026 Vendor Assessment Doc #US52992326 July 2026.